The following subsections describe the purpose of three charts supported by the application in relation to breed planning.
Traditional Chart
The Traditional chart is the most a popular of the three that, unfortunately, as a breeding tool has many shortcomings. Most notable is the importance it places on memory and knowing the names and titles of the ancestors, none of which is heritable. The custom has been for breeders to recognize and associate names and titles with what could be remembered about each ancestor. This approach lacks reliability and it does not capture the information needed to plan a breeding.
Most Traditional Pedigrees show scribbled notes around the edges and in the margins. Words such as "beautiful coat" and "wonderful type" become the information that is used. This approach fails to collect what is relevant or specific to making improvements. In short, breeders have no way to learn from their mistakes. See Figure 1 below.
Ch WeLove DuChein's R-Man, ROM, OFA
Ch. Kismet's Sight For Sore Eyes ROM, OFA, DNA certified
Ch  Kismet's Sweetheart Deal, ROM, OFA CH O'Danny Boy of Heinerburg, ROM, OFA, DNA certified
Ch  Schokrest San Diego, OFA
Magic Moment of Heinerburg OFA Cartel's Amber v Heinerburg, OFA
Figure 1: Traditional pedigree
Two other charts were developed to compensate for the limitations of the Traditional chart. One is the Stick Dog Color Chart (Figure 2). Its focus is on the seven traits of conformation. The other is the Symbols Chart (Figure 3). It is used to track and analyze health, performance, and other traits of interest.
Stick Dog Color Chart
The Stick Dog Color Chart focuses on seven traits of conformation allowing breeders to see the strengths and weaknesses of each ancestor based on the breed standard.
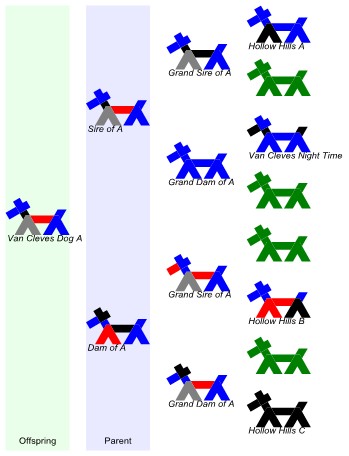
Figure 2: Stick Dog Color Chart Pedigree
The logic underlying this pedigree is that each ancestor is represented as a stick figure of coded information. Each ancestor is drawn as a stick figure with seven structural parts: ears, head, neck, front, back, rear, and tail. Each part is coded for its quality using four mutually exclusive colors. Each color signifies the rank or quality of the trait based on the breed standard. Notes may be added to each stick figure to supplement and clarify the color codes.
| Codes | Rank for Quality |
|---|---|
| Blue | Correct based on breed standard |
| Black | Could be improved |
| Red | Is a fault |
| Grey | A serious fault or disqualification |
| Green | Missing information |
The rules used to code the quality of a trait are straightforward. When a trait is coded with a first place color (blue), it is viewed to be correct or ideal based on the breed standard. For example, if the ears on a sire were coded blue and those on the dam were coded black, the breeder would know that the sire's ears were correct but the ears on the dam were not correct and lacking in some way. Thus, the color- coding of each ancestor identifies their qualities along with their specific strengths and weaknesses. The color codes also show if there are trends or problems on the sire or dam side of the pedigree.
Symbols Chart
Breeders interested in health, temperament, or special traits need to use this pedigree. It captures and displays the strengths and weaknesses of each ancestor and all of their littermates. Breeders can code the carriers of health problems or some special trait of interest on the sire or dam side of the pedigree. Knowing where, and how often traits occur increases the probability that improvements can be made and problems controlled or eliminated.
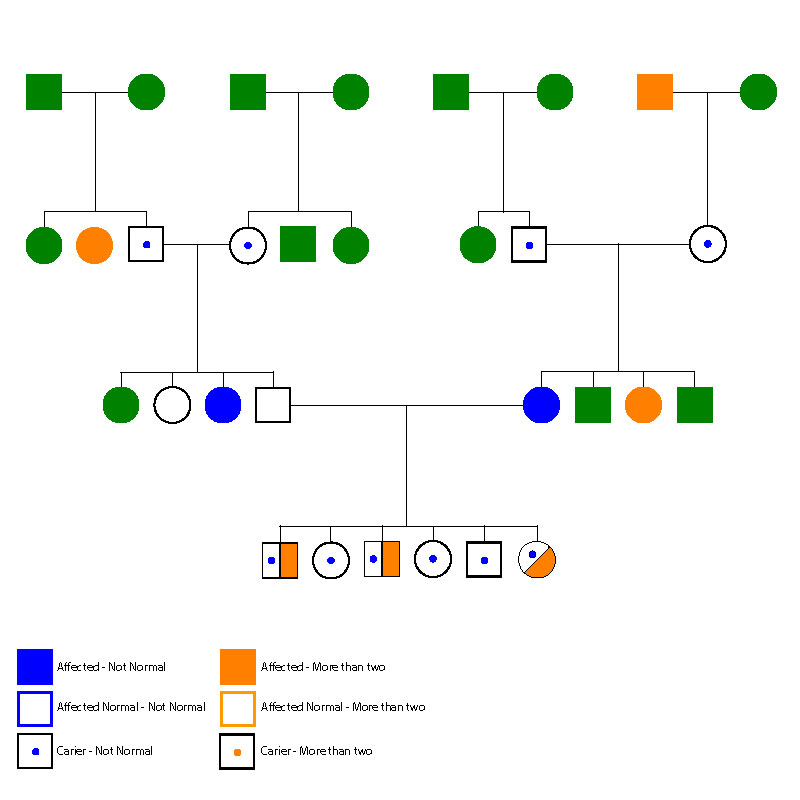
Figure 3 - Symbols Pedigree Chart
The Symbols Chart gets its name because symbols rather than names are used to identify each ancestor. The inclusion of littermates at all levels except the oldest generation further distinguishes this pedigree from the others. Its great advantage is that it produces a record of information that can be used to make improvements and eliminate problems.
Squares are used to represent the males and circles to represent the females. The littermates for each ancestor are also represented as either a circle or a square. As information is collected about each individual, it is coded using designated colors that represent specific traits or diseases. Because breeders are interested in many traits and diseases, they will use several colors to code this pedigree. The repetition of a color, key word or phrase usually signals that a genetic trend or pattern may be present.